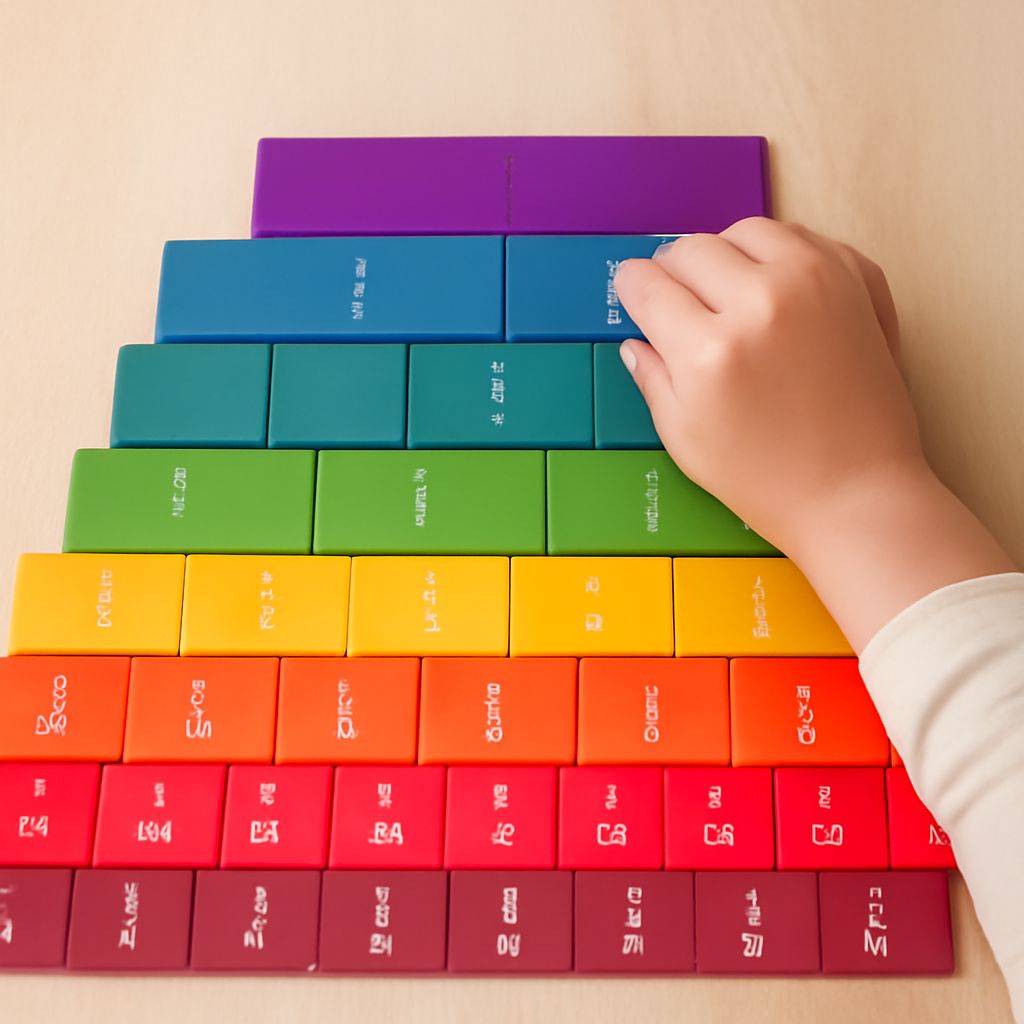
A fractions chart is an invaluable educational tool that assists students in understanding the relationship between different fractions. It visually displays various fractions in a structured format, often alongside decimals and percentages for comprehensive learning. A fractions chart can simplify complex mathematical concepts, making it easier for learners to grasp the fundamentals of fractions.
What is a fractions chart?
A fractions chart is essentially a visual representation of fractions arranged in an organized manner. Typically, it includes fractions from simple to more complex ones, sometimes spanning from 1/2 to 1/12 or more. The chart can also incorporate equivalent fractions, decimals, and percentages. This structured arrangement allows students to see how fractions relate to one another at a glance.
How to read a fractions chart
Reading a fractions chart involves understanding the increments and how different fractions compare. Start by identifying the largest fraction at the top of the chart. As you move down, fractions are broken into smaller and more precise segments. By following the chart horizontally, you can locate equivalent fractions and their decimal and percentage counterparts. This method helps build a foundational understanding of how fractions interact and transition between forms.
Benefits of using a fractions chart
The primary benefit of a fractions chart is that it provides a visual aid for students, making abstract concepts more tangible. This tool enhances comprehension and retention, as learners can easily compare and convert between fractions, decimals, and percentages. A fractions chart can also be a reference for solving fraction-related problems, thus improving students’ confidence in their mathematical abilities. Additionally, it promotes independent learning, allowing students to explore and understand fractions at their own pace.
Understanding a fraction scale
A fraction scale complements a fractions chart by providing another dimension of understanding. While a fractions chart lays out fractions in a static way, a fraction scale visually measures the size or value of fractions. It acts much like a ruler, where fractions are marked along a line to demonstrate their relative sizes. This tool is particularly useful in practical applications, such as measuring ingredients or dividing objects into equal parts.
In educational settings, both a fractions chart and a fraction scale can work in tandem. The chart provides the overview and comparative aspect, while the scale offers a more intuitive grasp of the size and proportion of fractions. By utilizing both tools, learners can gain a comprehensive understanding of fractions, ultimately leading to greater success in mathematical tasks.